Back to SeqWord Project main page


LingvoCom 1.0

Oligonucleotide usage pattern comparison and visualization

Program download

Last update: April 25, 2012

The program LingvoCom is written in Python and requires Python ver. 2.5 to be installed on the machine. The program works with DNA sequences in FASTA or GenBank formats. Visualizations are saved as vector graphic SVG files, which may be viewed by Mozilla Firefox or Chrome browsers, or vector graphic editors such as Adobe Illustrator.

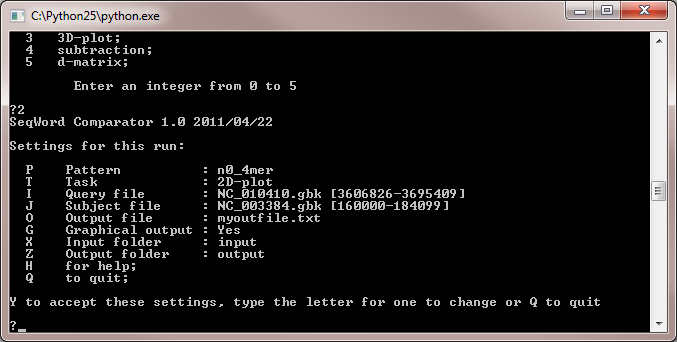
  • To run the program on a Windows machine, double click the file lingvocom.py and a command prompt window will appear:

     
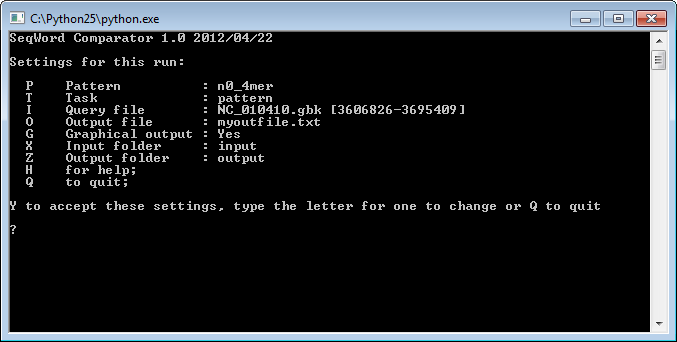
    to run the program, type <Y>+<Enter>;
  • In Linux type the command  python lingvocom.py;
  • Alternatively, the program may be run with a list of arguments:

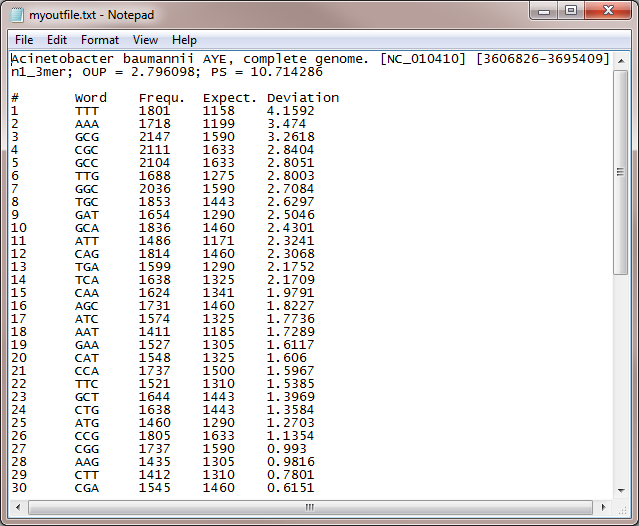
lyngvocom.py -p n0_4mer -t pattern -i "NC_010410.gbk [3606826-3695409]" -o myoutfile.txt -g Yes -x input -z output

When run like this, all 7 arguments must be set, otherwise a prompt menu will be shown.

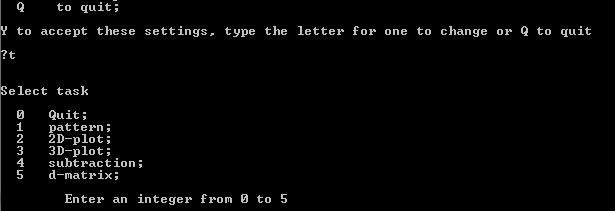
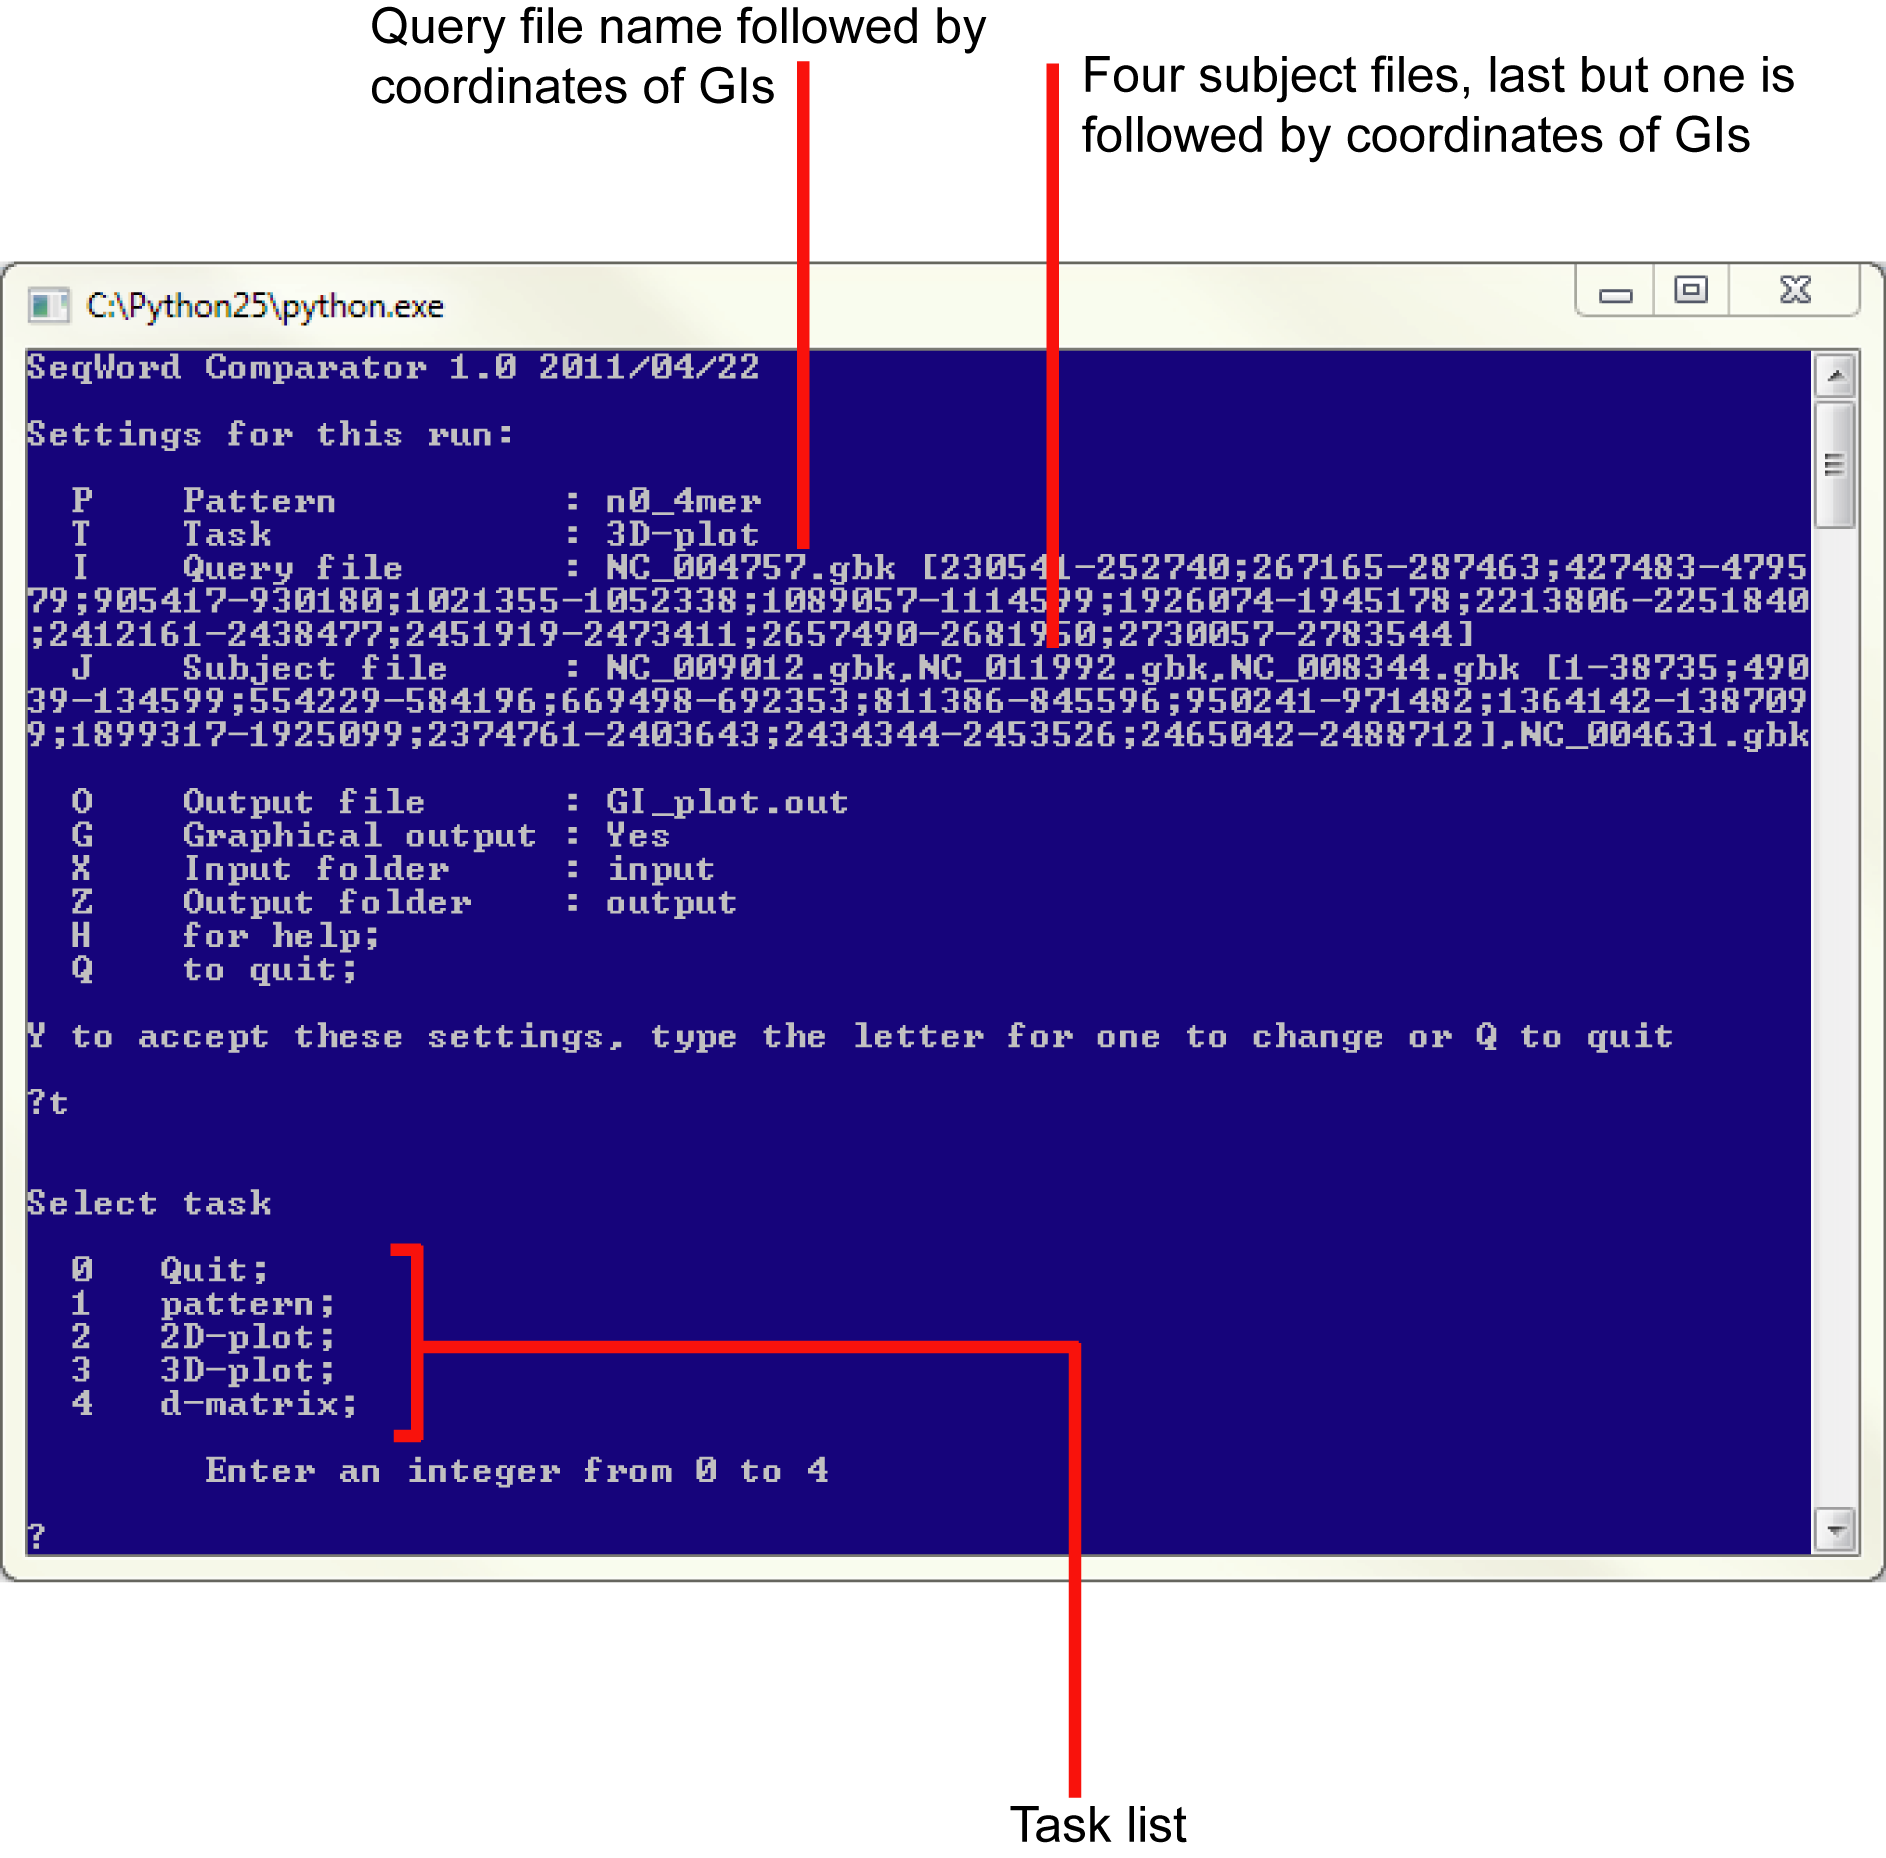
In the prompt menu to change the default setting for an argument, call it by typing the corresponding letter + <Enter>, then type or chose an alternative value.


Pattern

Pattern type is set in the format: nX_Ymer, where Y is the length of oligonucleotides to be counted; and X is the length of shorter constituent words used for calculations of expected frequencies of Y-mers.

By default n0_4mer is set, meaning that the program will analyze the given sequences for frequencies of tetra-(4)-nucleotides assuming that all words are equally expected (0-order normalization). If n1_3mer pattern is set, the program will analyze frequencies of tri-(3)-nucleotides assuming that the expected frequencies correlate with the GC-content (1-order normalization) of the DNA sequence.

Users may set Y values within the range from 2 to 7 and X values within the range from 0 to Y-1.

When <P>+<Enter> is typed, the program will suggest for comma separated X and Y values to be entered:


Task


Type <T>+<Enter> and select the type of analysis/visualization to be performed:

  • Quite - type <0>+<Enter> to return to the main menu;
  • Pattern - the program calculates expected and observed frequencies of selected oligonucleotides and returns the statistics as a text file and SVG visualization:


  • 2D-plot - is used for identification of possible donor-recipient relations by comparison of GIs from different genomes against each other and their host chromosomes. This analysis makes sense only when GIs from different organisms share a significant level of OU pattern similarity and the question is to which host genome these GIs are closer?
    When this task is selected, an additional entry J for the subject genome file will be added to the list of parameters:


    Two dark green spots on the plot represent OU patterns of the query (at the center point) and subject (on the horizontal axis) chromosomes. Light green circles depict ½ of the distance between patterns calculated for the chromosomes. GIs of the query genome are shown as red small circles and those of the subject genome if any are selected, as blue circles. Distances between GIs and host chromosomes may be inspected using the interactive SVG image file as shown above, or by checking the text output file.
  • 3D-plot - is used to group multiple genomes and their GIs in a 3D-projection. An example of input parameters and the resulted SVG image are shown below:


    Exact coordinates of each node in the 3D-space are listed in the text output file.
  • subtraction - is used to find the distance between two OU patterns and illustrate the mismatches word by word:


  • d-matrix - returns a Phylip formatted distance matrix in a text file that may be used immediately as the input file for the distance-based phylogenetic inferrence programs neighbour.exe, fitch.exe and kitsch.exe of the Phylip package.


Query/Subject file

Query and subject files may be in FASTA or GenBank formats, which are required to be stored in the folder "input" prior to the analysis. Upon analysis the results files are written as text and SVG into the folder "output". LingvoCom can further be utilized for analysis of the predicted GIs in GenBank or FASTA formats as generated by SWGIS. Alternatively, it may extract DNA fragments from the whole genome by the use of user defined genomic coordinates:

  • NC_010410.gbk - the whole genome sequence from the specified GenBank file will be used for analysis;
  • NC_010410.gbk [3606826-3695409] - a genome fragment located at the specified coordinates will be used for analysis; 
  • NC_010410.gbk [103117-225016;3606826-3695409] - the whole genome sequence and two specified loci will be compared;
  • NC_004757.gbk,NC_010410.gbk [103117-225016;3606826-3695409] - two genomes and two loci of one genome.

Quer and subject inputs are treated differently when differen tasks are performed:

  • Pattern - only query sequences are requested:
    • NC_010410.gbk - a pattern for the whole genome will be calculated;
    • NC_010410.gbk [3606826-3695409] - only one pattern for the locus 3606826-3695409 will be calculated;
    • NC_010410.gbk [103117-225016;3606826-3695409] - two patterns for two specified loci will be calculated;
    • NC_010410.gbk,NC_010410.gbk [3606826-3695409] - two patterns for the whole genome and for one locus will be calculaed;
  • 2D-plot - requires both query and pattern sequences, but only one genome file for the query and one for the subject may be set. Numbers of loci per genome are unlimited.
  • 3D-plot - uses all whole genome and local patterns specified in query and/or in subject entries, but in total there must be at least 4 differen patterns. Thus, NC_010410.gbk [3606826-3695409] entry stands for two patterns, one for the whole genome and another for the locus. Whole genome and local patterns will be depickted differently on the 3D-plot by squares and circles, respectively. Query patterns will be shown in red colour and subject patterns in blue.
  • subtraction - will be calculated only for the first query and first subject patterns.
  • d-matrix - at least one query and one subject sequences should be specified. All whole genome and local patterns specified in query and subject entries will be used.
Output file Provide this parameter with a generic name for the output files. The text output file will be saved under the provided name and for the SVG output file the corresponding extension will be added.
Graphical outputThis parameter may be set to either Yes or No. If set Yes, an additional output SVG file will be saved for data visualization.
Input folderThe name of an existing folder where input files will be looked for by the program. By default "input".
Output folderThe name of an existing folder where the output files will be saved. By default "output".