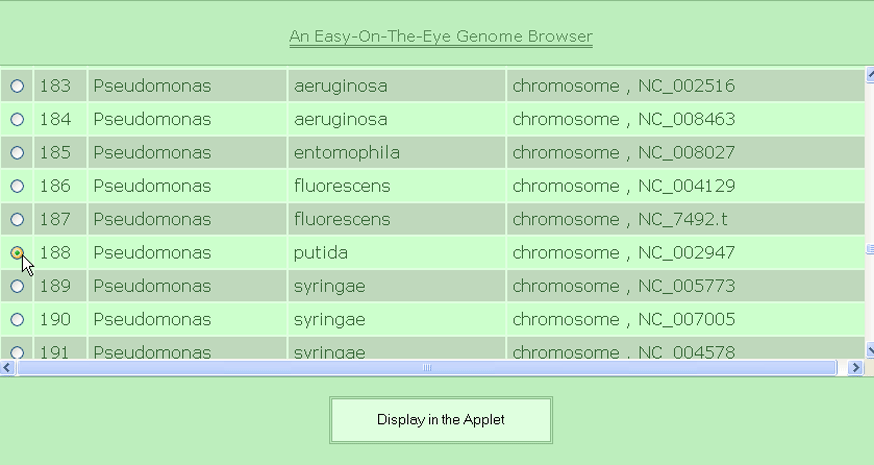
An Easy-On-The-Eye Genome Browser
|
See how to identify: |
To cite: Ganesan H, Rakitianskaia AS, Davenport CF, Tümmler B, Reva ON. The SeqWord Genome Browser: an online tool for the identification and visualization of atypical regions of bacterial genomes through oligonucleotide usage. BMC bioinformatics 9 (1), 333.
The SeqWord Genome Browser (SWGB) was developed to visualize the natural compositional polymorphism of DNA sequences by analysis of local oligonucleotide usage (OU) pattern signatures. The applet is also used for identification of divergent genomic regions both in annotated sequences of bacterial chromosomes, plasmids, phages and viruses; and in raw DNA sequences prior to annotation by comparing local and global OU patterns. The applet allows fast and reliable identification of clusters of horizontally transferred genomic islands, large multidomain genes, non-coding sequences and genes for ribosomal RNA. Within the majority of genomic fragments (also termed genomic core sequence) regions enriched with housekeeping genes, ribosomal proteins and the regions rich in pseudogenes or genetic vestiges may be contrasted.
Several informative OU statistical parameters (D, PS, RV, GRV, GC and GCS) were calculated for local OU patterns to facilitate prediction of gene classes. A database of pre-calculated OU patterns determined for 8 kb long overlapping fragments of bacterial chromosomes with a step of 2 kb was developed. Alternatively, a standalone program for deriving data (OligoWords) and a local version of the Genome Browser are available to analyse your own DNA sequences locally.
To analyze a genome of interest try the following steps:

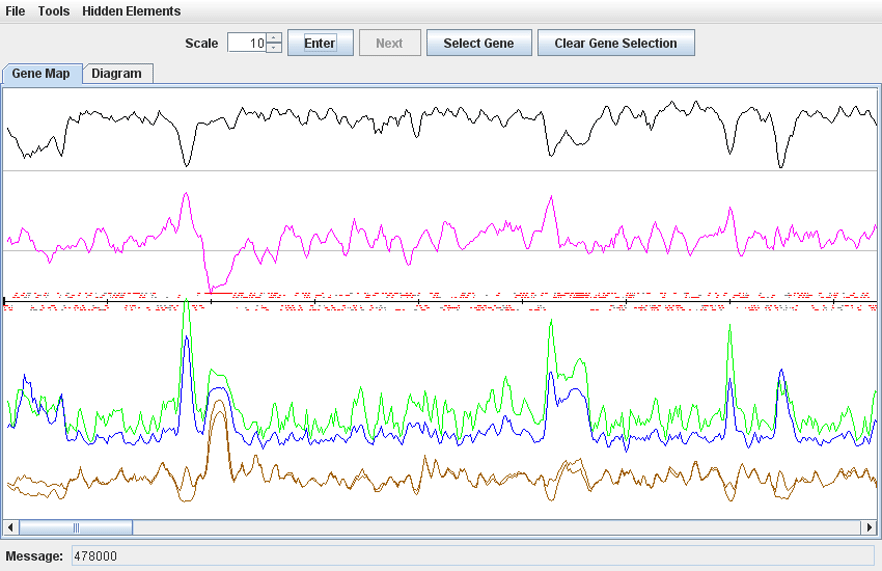
· To change the scale of the map, select a value from 0.1 to 10 in the ‘Zoom’ counter and click ‘Enter’.
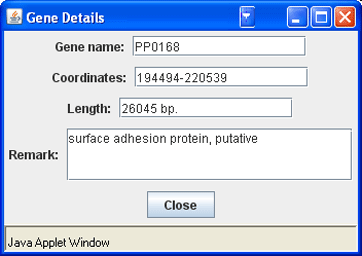
· To get information about a gene, move the mouse pointer over the gene bar on the map and read the description in the ‘Message’ field. Or click the gene to open the ‘Gene Details’ window.
· To highlight a genomic region, choose Tools->Select Region, enter the coordinates of the region in the dialog and press ‘Ok’. To remove highlighting, choose Tools->Clear selection.
· To display a genomic region in the applet window, choose Tools->Zoom into region, enter the coordinates of the region in the dialog and press ‘Ok’. To remove the zoom, choose Tools->Clear zoom.
· To highlight a gene on the map, click the button ‘Select Gene’, sort the genes in the dialog by names, functions or coordinates, and click ‘Ok’. To remove highlighting, click the button ‘Clear Gene Selection’.
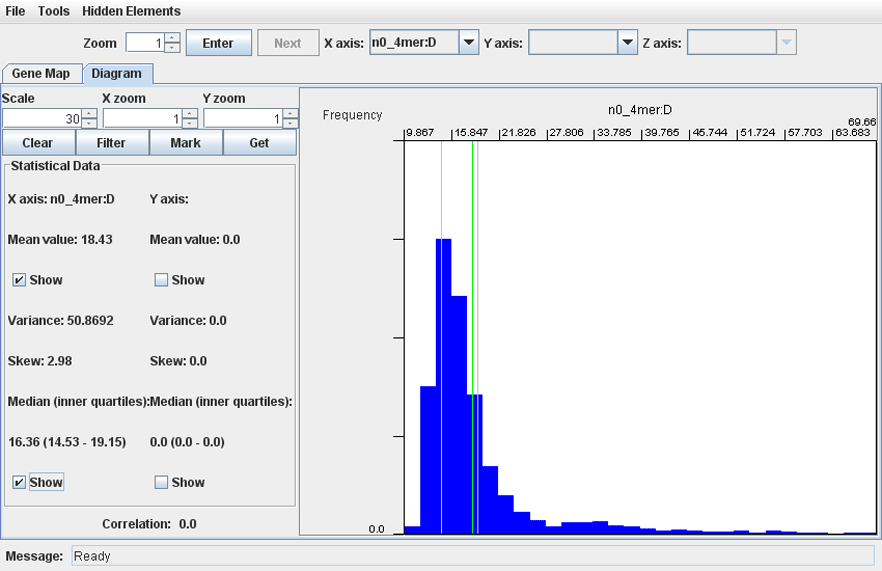
· Select a parameter for the axis X or Y and click ‘Enter’. The program shows a histogram of distribution of the parameter’s values among genomic loci. The ‘Statistical Data’ panel reads arithmetic average, standard deviation, skew and inner quartiles values of the distribution. To show the mean value and quartiles, set corresponding checkboxes. To change the number of columns in the histogram, select the appropriate value in the counter ‘'# bars’ and click ‘Enter’.
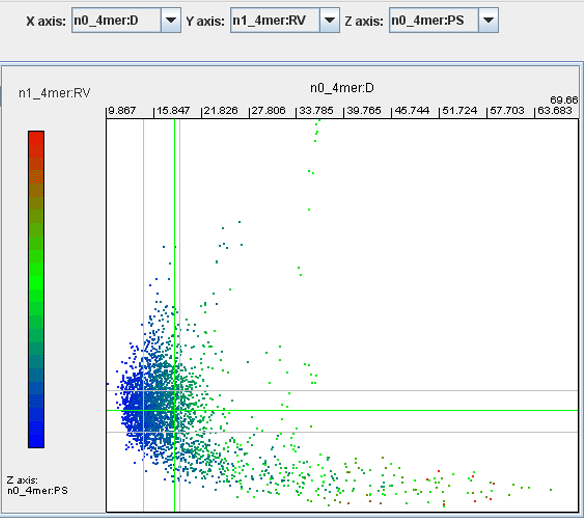
· To analyze distributions of several OU statistical parameters at the same time, choose appropriate values in the combo boxes ‘X axis’, ‘Y axis’ and ‘Z axis’. Click ‘Enter’. The program shows a dot-plot matrix where each dot corresponds to an 8 kb long genomic fragment.
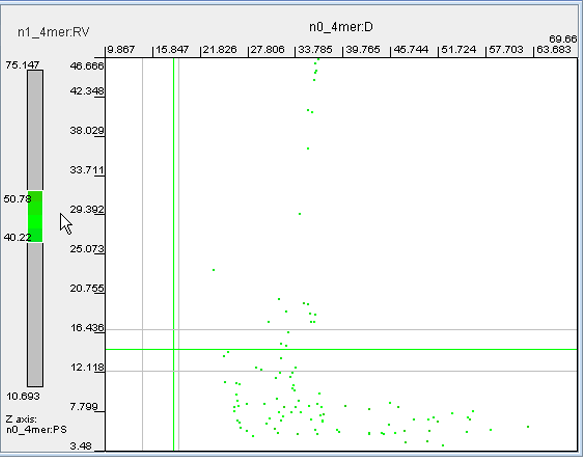
· To filter the genomic fragments by the third parameter, select a part of the color bar you want to display using the mouse pointer . To cancel filtering, double click the grey part of the color bar.
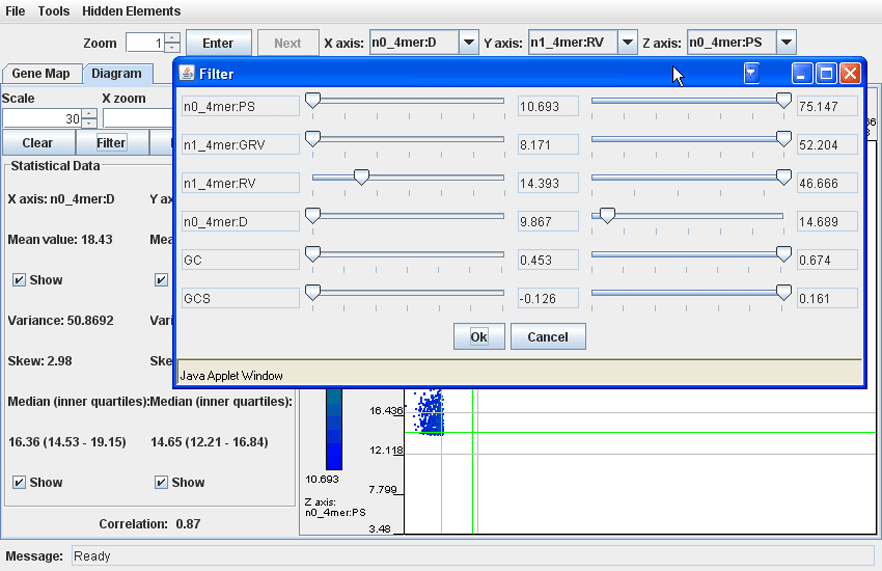
· Filtering may be performed with all available parameters, not only those that were selected for axes X, Y and Z. To set up filtering, click the button 'Filter' and in the dialog that pops up set the minimal and maximal values of any parameters of interest. Click 'OK'. The dots of the genomic fragments with values outside of the set thresholds will be removed from the dot plot. To cancel filtering, open the 'Filter' dialog again and move all left sliders to the far left position, and all right sliders to the far right position. Click 'OK'.
· Using the mouse, draw a box around a group of dots on the plot and click ‘Get’. The program returns a list of genomic loci represented by the outlined dots. Overlapping genomic fragments will be automatically concatenated and the coordinates of the loci in the list are accompanied with the annotation information of the constituent genes.
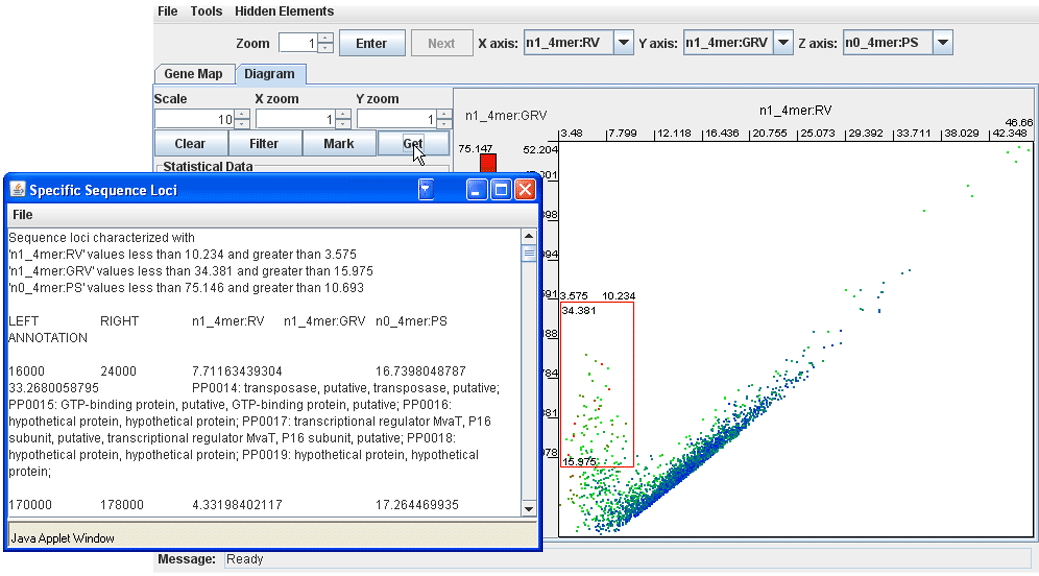
· Double clicking a dot on the plot redirects us back to the ‘Gene Map’ tab where the corresponding genomic fragment will be highlighted.
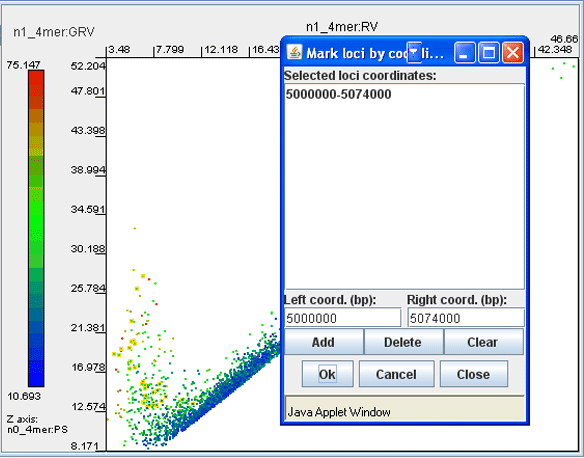
· Click the button ‘Mark’ and in the dialog enter the coordinates of genomic fragments of interest (coordinates of several fragments may be added to the list). Click ‘Ok’. The corresponding dots on the dot-plot will be highlighted. To remove highlighting and/or the selector frame, click the button ‘Clear’.
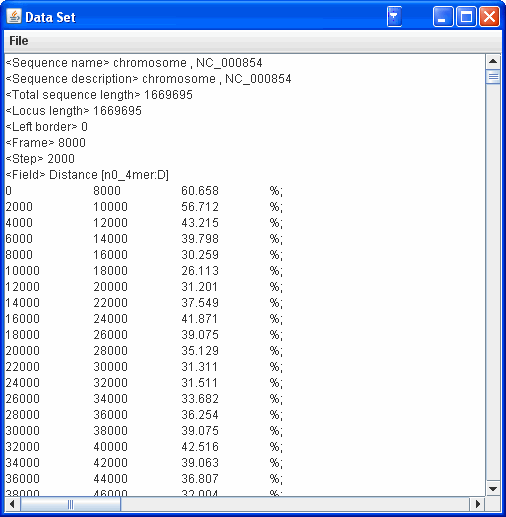
Users are able analyze their own novel sequences on a local PC. The command line Python program OligoWords is first used to analyse a FASTA or GenBank formatted sequence. The program is available for download in several packages containing precompiled executable files. Since the SWGB is implemented as a Java applet, it can be run within a web browser locally. The HTML-embedded applet SeqWord_Viewer.###.zip is available for download from the same site. The text file output from OligoWords is read into the SWGB via the 'Open' function of the 'File' menu, and the complete functionality of the online system is then available. You can read more about the standalone programs here.